HomePlatformSolutionsArcIn AIResourcesCustomers
Login Request Demo Free Trial →
Platform · Observability

Turn telemetry into
operational certainty.

Applicare delivers full-stack observability — metrics, traces, and logs unified with AI-driven correlation in one platform — so your platform, SRE, and operations teams resolve incidents faster, cut alert noise, and run cloud-native at scale with confidence. Not just dashboards. Answers.

📊 Metrics 📜 Logs 🧵 Traces Applicare ArcIn AI ✨ Correlated insight
60%
Average MTTR reduction post-rollout
Faster root cause identification
70%
Less alert noise reaching on-call
100%
OpenTelemetry-native instrumentation
The challenge

Cloud-native moved fast.
Observability didn't keep up.

Microservices, Kubernetes, and continuous delivery multiplied your telemetry — and your blind spots. Most teams have more dashboards than answers. These are the patterns Applicare is built to fix.

🔔
Alert fatigue
Thousands of low-signal alerts bury the few that matter. On-call teams burn out, real incidents get missed, and trust in monitoring erodes.
🧩
Tool sprawl
Separate tools for metrics, logs, traces, and infra. Context is scattered across tabs and teams, and the integration tax keeps growing.
☸️
Kubernetes complexity
Ephemeral pods, autoscaling, and service meshes make traditional monitoring blind. Cardinality explodes and correlation breaks down.
🐢
Slow root cause analysis
When everything is green but customers are complaining, teams spend hours pivoting between tools instead of resolving the incident.
🗺️
Lack of operational context
Metrics without dependencies, deploys, or change history. Engineers see what broke but not why — or what to do next.
💸
Spiraling telemetry cost
Unbounded data volumes drive unpredictable bills. Without a data strategy, observability becomes a line item finance starts questioning.
The Applicare platform

One platform for metrics, traces, and logs — at enterprise scale.

Applicare unifies full-stack telemetry into a single, high-cardinality analytics engine built for cloud-native operations — with AI-driven intelligence built in.

📊
Metrics at massive scale
Ingest and query millions of high-cardinality time series per second without sampling away the detail that matters.
🧵
Distributed tracing
Follow every request across services to pinpoint the exact span where latency and errors originate.
📜
Logs in context
Correlate logs directly with the metrics and traces around an incident — no more tab-hopping to reconstruct a timeline.
🧠
Intelligent alerting
Dynamic thresholds and analytics-driven alerts surface real problems and suppress the noise.
☁️
Cloud-native monitoring
Purpose-built for Kubernetes, microservices, and dynamic infrastructure — auto-discovering what changes.
Applicare — Service Health⬤ Live
Request Rate
48.2k/s
checkout-svc · stable
p99 Latency
214ms
SLO 300ms · healthy
Error Rate
1.8%
payments-api · elevated
Saturation
62%
node pool · within range
🧠 Insight: Error spike on payments-api traced to span db.query after deploy v2.3.1 — 340ms slower than baseline. Suggested owner notified.
Key capabilities

Full-stack visibility, engineered for scale.

🖥️
Infrastructure Monitoring
Hosts, containers, cloud services, and network — unified health across hybrid and multi-cloud estates.
☸️
Kubernetes Monitoring
Clusters, namespaces, pods, and workloads auto-discovered and mapped — from control plane to container.
Application Performance
Golden signals per service — latency, traffic, errors, saturation — tied to the user experience they drive.
🧵
Distributed Tracing
End-to-end request flows across every hop, surfacing the slow span and the failing dependency instantly.
🤖
Anomaly Detection
Analytics-driven baselines catch deviations before they breach SLOs — without hand-tuned thresholds.
📈
Capacity Planning
Trend-based forecasting and rightsizing backed by real utilization — so you provision for reality, not fear.
Inside the product

Trace every transaction to the slow endpoint.

App Analyzer breaks down live HTTP traffic by endpoint — call volume, error counts, and response-time percentiles — so you can see exactly which transactions are slow or failing. It's the request-level view inside Applicare's full-stack tracing, linking each endpoint back to the traces, deploys, and logs behind it.

🧵
Per-endpoint breakdown
Count, errors, and min/avg/max response time for every HTTP transaction — sorted to surface the worst offenders first.
🔎
Drill from symptom to span
Click any slow endpoint to follow the trace across services and land on the exact span driving the latency.
Applicare — App Analyzer⬤ Live
Applicare App Analyzer — HTTP transaction performance by endpoint

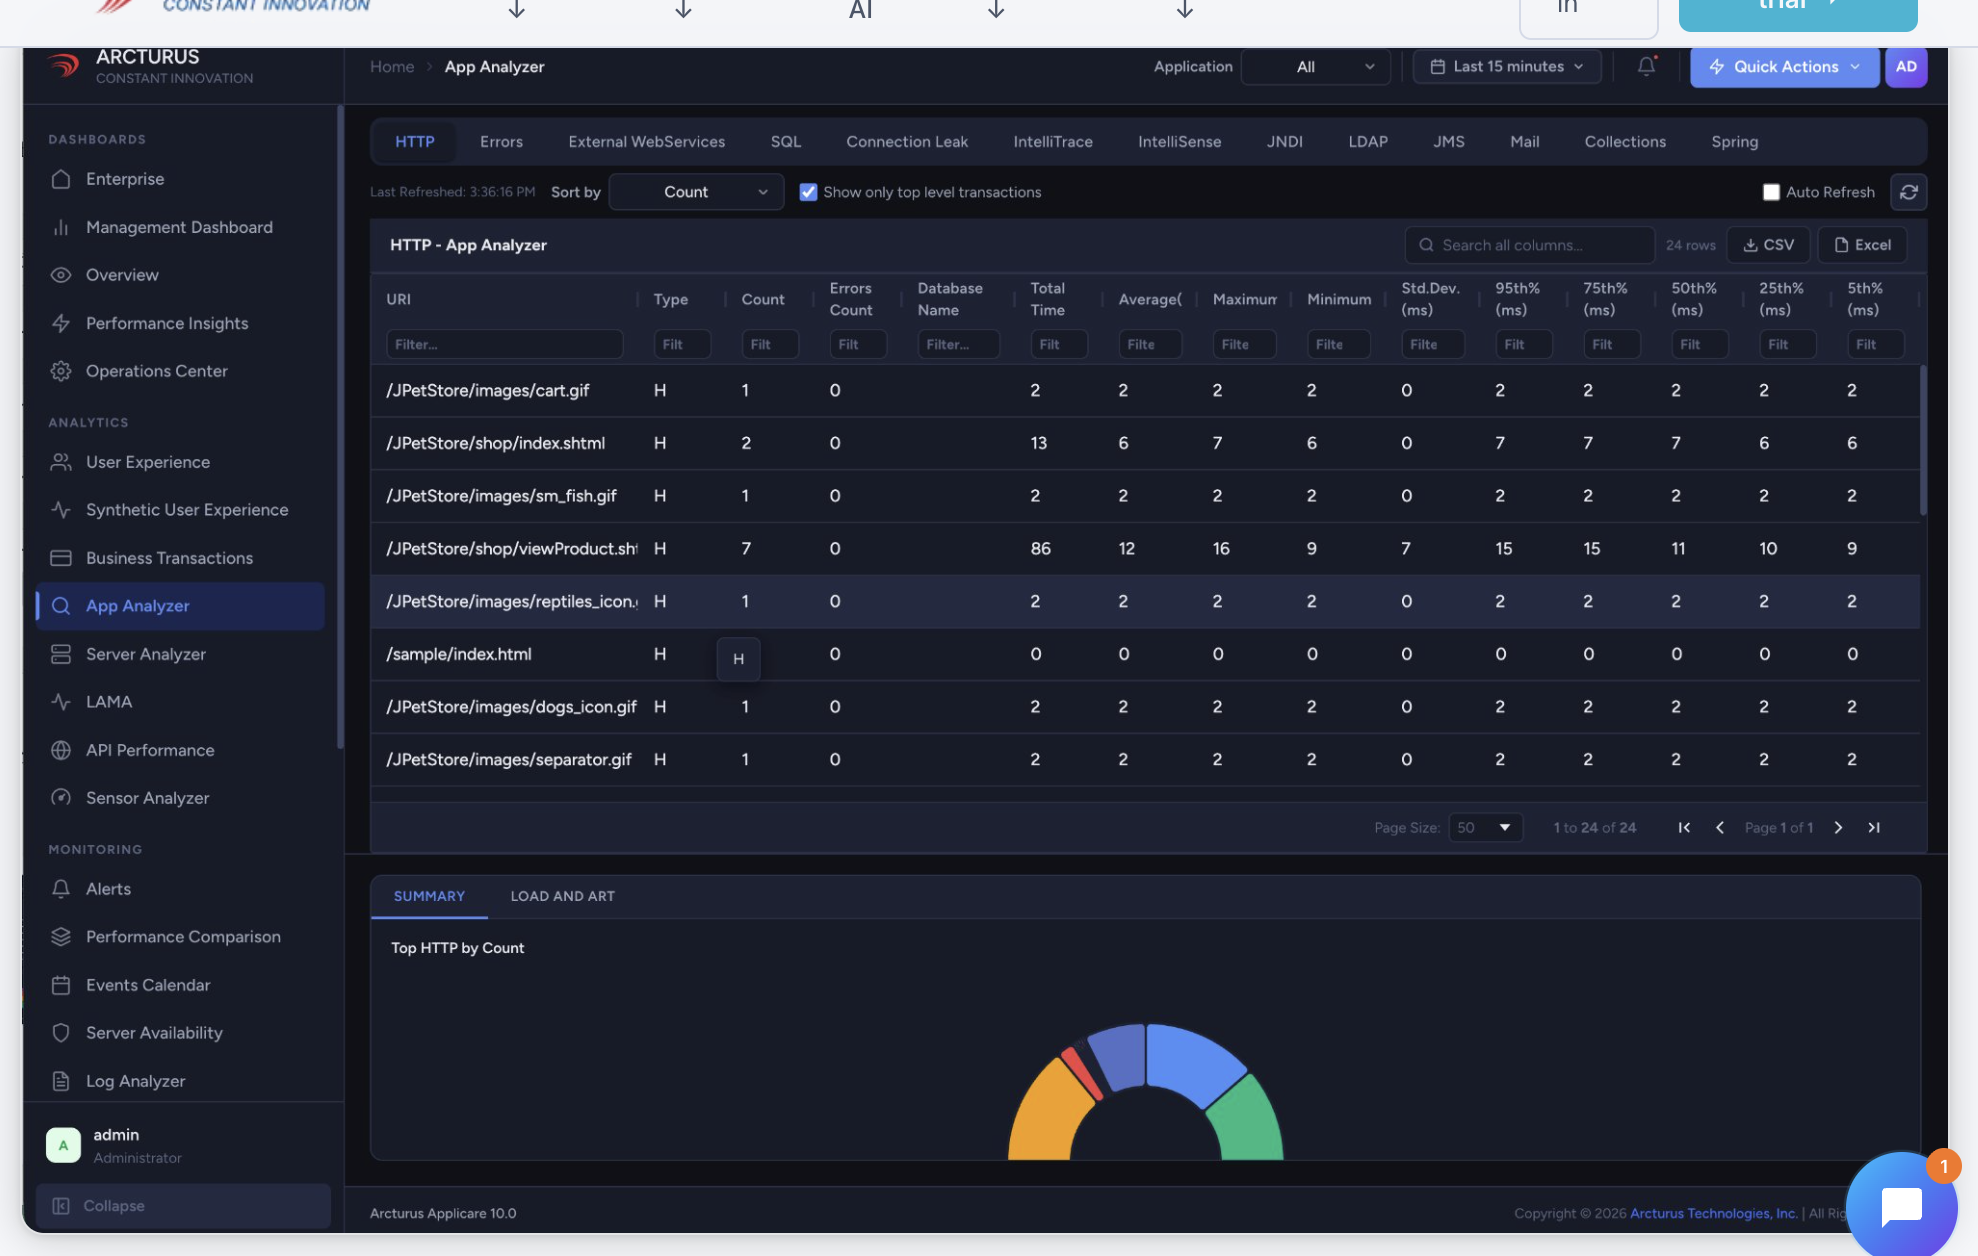
App Analyzer — HTTP transaction performance, part of Applicare's full-stack tracing

Reference architecture

From application to action —
one telemetry pipeline.

🧱
Applications & Infrastructure
Microservices, Kubernetes, hosts & cloud services emitting metrics, traces & histograms
🔌
OpenTelemetry
Vendor-neutral instrumentation with the Applicare exporter — or any OTel SDK
🛰️
Applicare Ingestion
Native OTLP over gRPC :4317 & HTTP :4318 — zero proprietary agents
🧠
Applicare + ArcIn AI
Entity graph, streaming analytics & AI-driven anomaly detection
👩‍💻
Operations Teams
Dashboards, alerts & SLOs consumed by SRE, platform & DevOps teams

Applicare is OpenTelemetry-native — ingest data from any OTel SDK or Collector with zero proprietary agents and zero vendor lock-in — then ArcIn turns signals into decisions, not just dashboards.

Customer stories

Real teams. Measurable outcomes.

From retail to telecom, enterprises run on Applicare observability to cut alert noise, resolve incidents faster, and protect the customer experience.

Global Retail Enterprise
Challenge
Peak-season campaigns caused inventory mismatches and abandoned carts from cascading failures across checkout, pricing, and payment services.
Solution
Unified observability with ArcIn AI and Entity Graph correlation.
  • 82% fewer false-positive alerts
  • Black Friday campaign readiness
  • 41% fewer abandoned-cart incidents
  • Faster engineering–business coordination
Leading Financial Institution
Challenge
Hundreds of applications generated fragmented alerts, making investigations slow and audit reporting difficult.
Solution
Cross-stack observability with automated dependency mapping.
  • 70% less war-room participation
  • Audit-ready incident timelines, automatically
  • Visibility across 500+ applications
  • Higher change confidence for release teams
Global SaaS Provider
Challenge
Developers spent hours switching between logs, traces, and dashboards to troubleshoot customer issues.
Solution
AI-powered correlation and natural-language root cause analysis.
  • 1,500+ engineering hours saved annually
  • 2.5× higher release frequency
  • Less context switching across tools
  • Faster onboarding & productivity
Healthcare Technology Company
Challenge
Patient-facing applications required uninterrupted performance and strict SLA compliance.
Solution
Continuous observability with proactive anomaly detection.
  • SLA compliance improved to 99.995%
  • 58% fewer recurring incidents
  • Confident, safe software upgrades
  • Clear application-dependency visibility
Global Logistics Company
Challenge
Shipment-tracking systems hit intermittent failures across multiple regions.
Solution
Distributed tracing and dependency-aware observability.
  • Global transaction visibility
  • 63% fewer duplicate support tickets
  • Hidden infrastructure bottlenecks found
  • Better experience at peak demand
Digital Media Platform
Challenge
Live-streaming traffic spikes caused unpredictable latency and poor user experience.
Solution
Real-time observability with dynamic baselines and anomaly detection.
  • 52% fewer buffering complaints
  • More consistent streaming quality
  • Accurate capacity planning
  • Lower overprovisioning costs
Manufacturing Enterprise
Challenge
Production applications lacked visibility across factories and edge systems.
Solution
Unified telemetry and topology mapping.
  • Visibility across distributed sites
  • 68% less manual troubleshooting
  • Faster production root-cause analysis
  • Stronger IT–operations collaboration
Global Telecommunications Provider
Challenge
Network incidents generated thousands of alerts daily, overwhelming operations teams.
Solution
AI-driven event correlation and automated incident intelligence.
  • 85% lower alert volume
  • Focus on high-priority incidents
  • Shorter escalation chains
  • Better reliability without more headcount
Why Applicare

More than monitoring.
Operational intelligence, built in.

Tools alone don't transform operations — intelligence does. Applicare unifies full-stack telemetry, AI-driven correlation, and automation in one platform, so teams act on insight, not raw data.

🎯
Unified Observability
Metrics, traces, and logs in one platform — no tool sprawl, no context-switching, one source of truth.
🔌
OpenTelemetry-Native
Standards-based, vendor-neutral ingestion across your stack — zero proprietary agents, zero lock-in.
☸️
Built for Kubernetes
Cloud-native by design — from cardinality control to service mesh and multi-cluster visibility.
🚨
Faster Incident Response
Dynamic baselines, SLO burn-rate alerts, and guided runbooks turn chaos into a calm, repeatable response.
🧠
ArcIn Operational Intelligence
AI-driven correlation and context surface the probable cause and likely owner automatically.
🏗️
Platform Engineering Ready
Self-service observability built into your internal developer platform — golden paths, not gatekeeping.
Business impact

Outcomes the board can measure.

Observability is an operational investment — and it should show up in the numbers that matter to the business.

↓ 60%
Reduced MTTR across critical services
Faster incident resolution
↑ 99.9%
Improved reliability against SLOs
↑ UX
Better user experience & retention
↓ 70%
Reduced alert noise & on-call fatigue
↑ Velocity
Increased engineering productivity
Better together

Applicare + ArcIn = root cause in minutes.

ArcIn, the AI engine inside Applicare, layers correlation and context across all your telemetry — closing the gap between "something's wrong" and "here's why."

🔗
Correlates telemetry
Unifies metrics, traces, and logs into a single incident narrative instead of disconnected signals.
🕸️
Maps dependencies
Builds a live service and infrastructure topology so blast radius is obvious at a glance.
🔄
Connects infrastructure changes
Ties deploys, config changes, and scaling events to the moment behavior shifted.
Accelerates root cause analysis
Surfaces the probable cause and likely owner automatically — collapsing investigation time.
🚀
Improves operational speed
Turns hours of war-room triage into minutes of confident, evidence-backed action.
ArcIn — Root Cause Correlation⬤ Live
Active Incident
payments-api · p99 ↑ 340ms
SLO burn rate 4.2× · 3 services impacted
🧠 ArcIn correlation: Latency began 90s after config-change #4821 on payments-api. Trace shows db.connpool exhaustion → upstream checkout-svc & cart-svc degraded.
✓ Recommended action: Roll back config-change #4821 · likely owner: payments-platform team · est. resolution 4 min.
Get started with Applicare

Full-stack observability, without the complexity.

See Applicare live on your environment, or start a free trial. Faster incident resolution, less alert noise, and measurable reliability — with AI-driven intelligence built in.

  • Enterprise-grade platform
  • OpenTelemetry-native
  • Kubernetes & SRE ready
  • AI-driven correlation