See which containers talk to each other. Find where requests fail.
See which containers communicate, which networks and ports they use, and where errors or slow responses appear. Use observed traffic to decide which dependency to investigate first.
Applicare lists the container-to-container calls it actually saw, so platform engineers, DevOps teams and SREs can answer four practical questions.
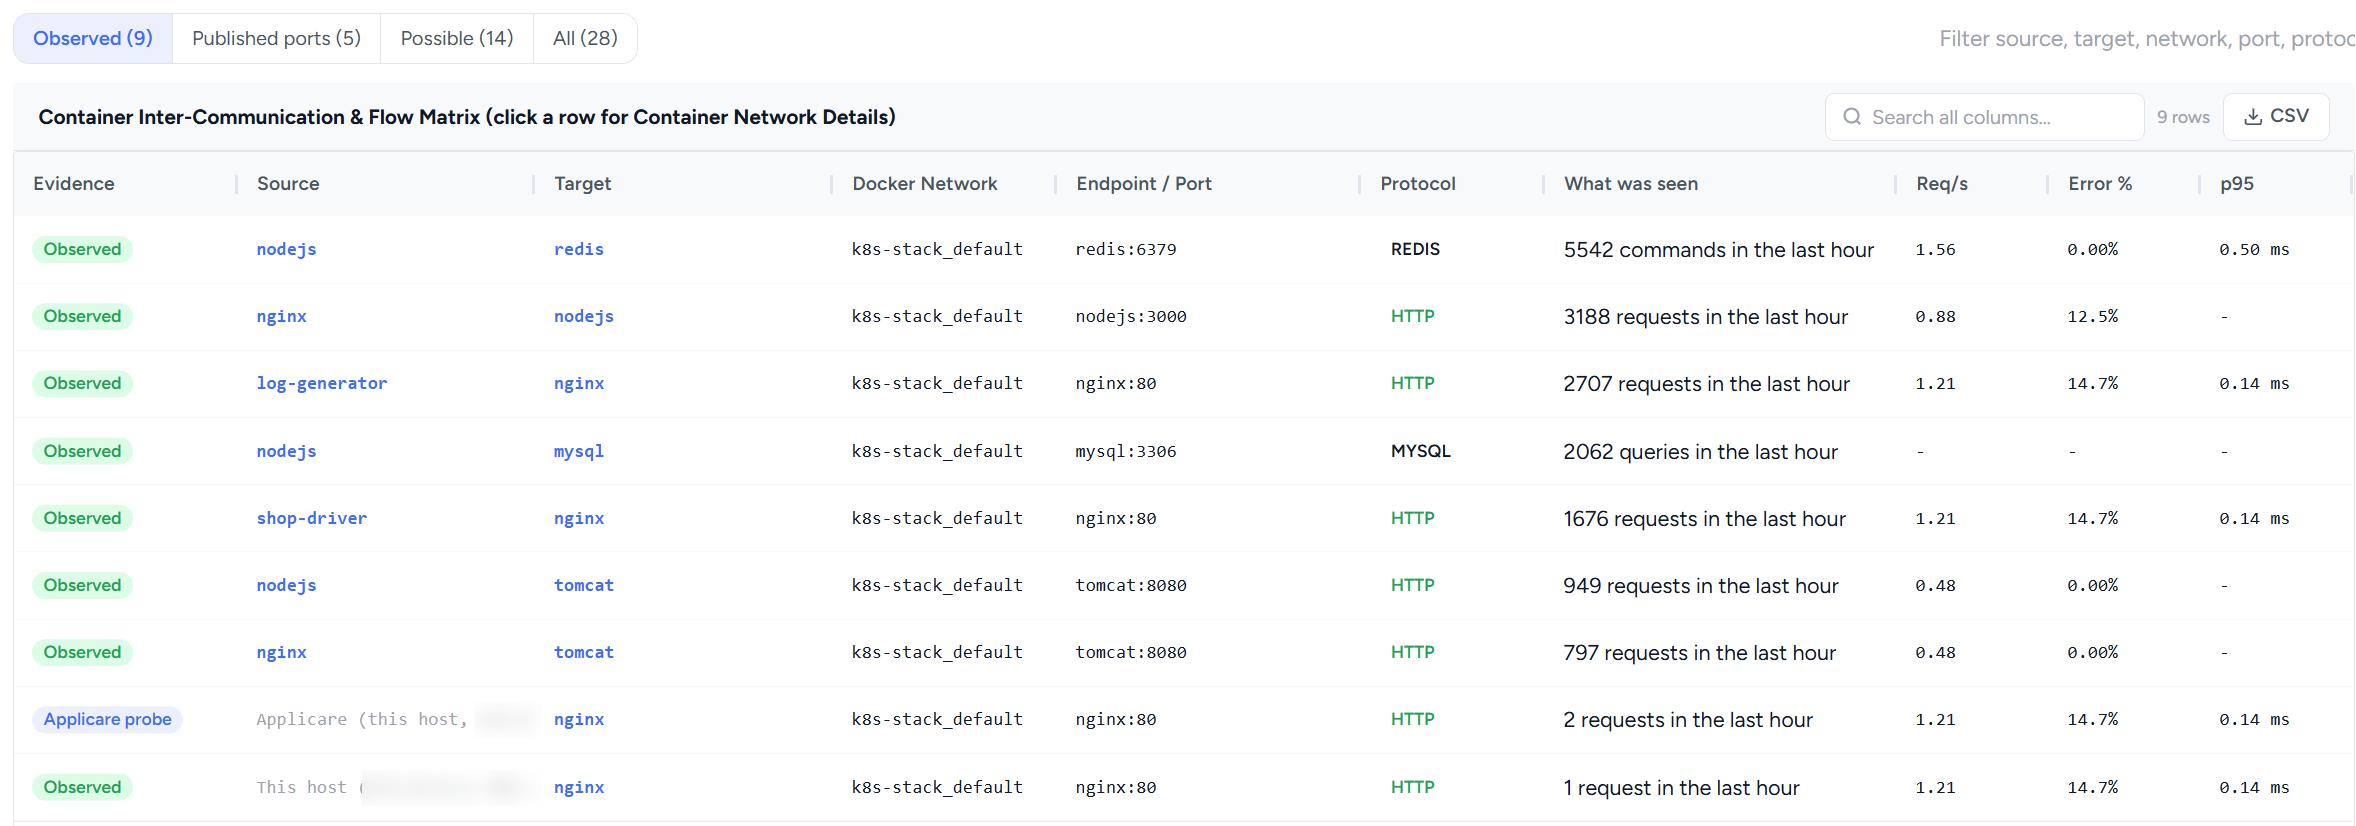
The Observed view lists every container-to-container call Applicare saw on the selected Docker engine: who called whom, on which port and protocol, how many times, and how the called container is doing.
Every row is labelled. Observed is a real call between containers. Applicare probe is Applicare’s own health check, kept separate from the traffic your containers generate.
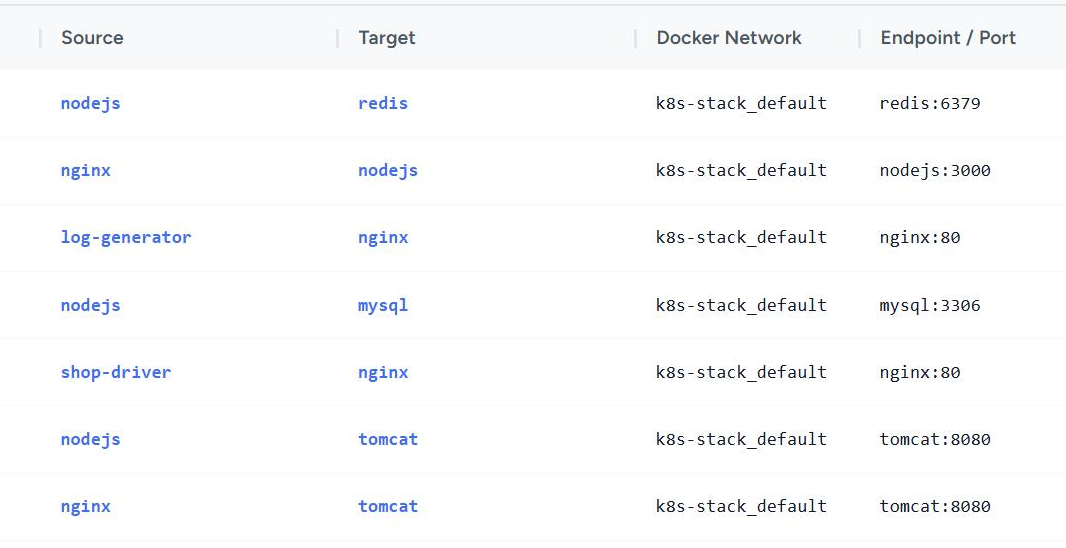
This is the Container Inter-Communication & Flow Matrix for one Docker engine over the last hour. The two callouts below show how to read it.
Swipe to explore · tap Enlarge to zoom
Calls from nginx to nodejs show a 12.5% error rate here, which makes that dependency a place to start investigating. Treat Error % as a signal for where to look, not as a diagnosis.
In the selected hour, this is the busiest path in the table, so it is the first place to check when you want to know what carries the most traffic.
Screenshots from the Docker Monitoring walkthrough, taken from a demo. Choose a screen, then use Enlarge to see it full size.

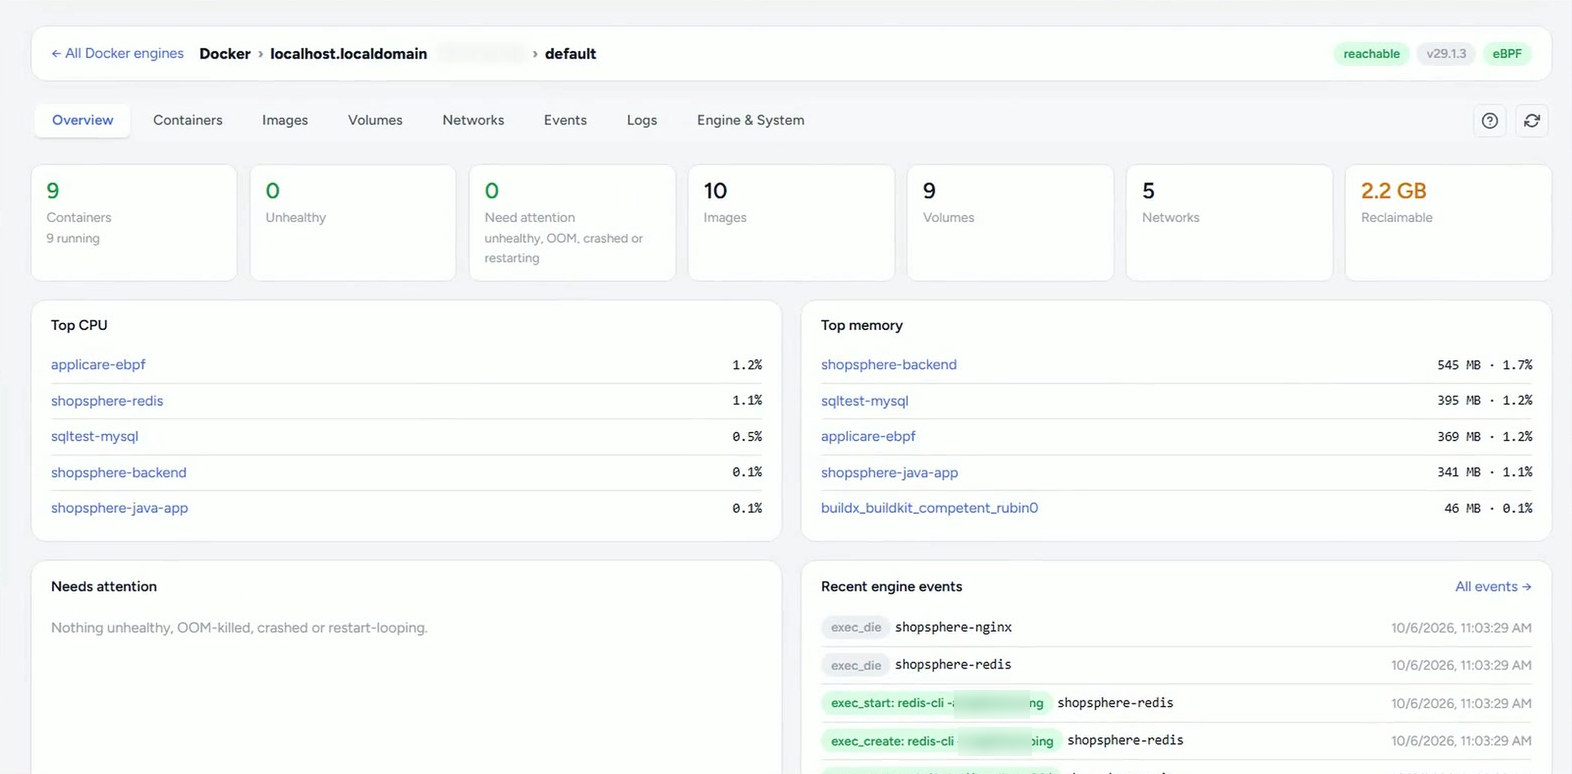
Containers running and unhealthy, anything that needs attention, and the number of images, volumes and networks, with reclaimable disk space. Top CPU and top memory consumers and the latest engine events sit below.

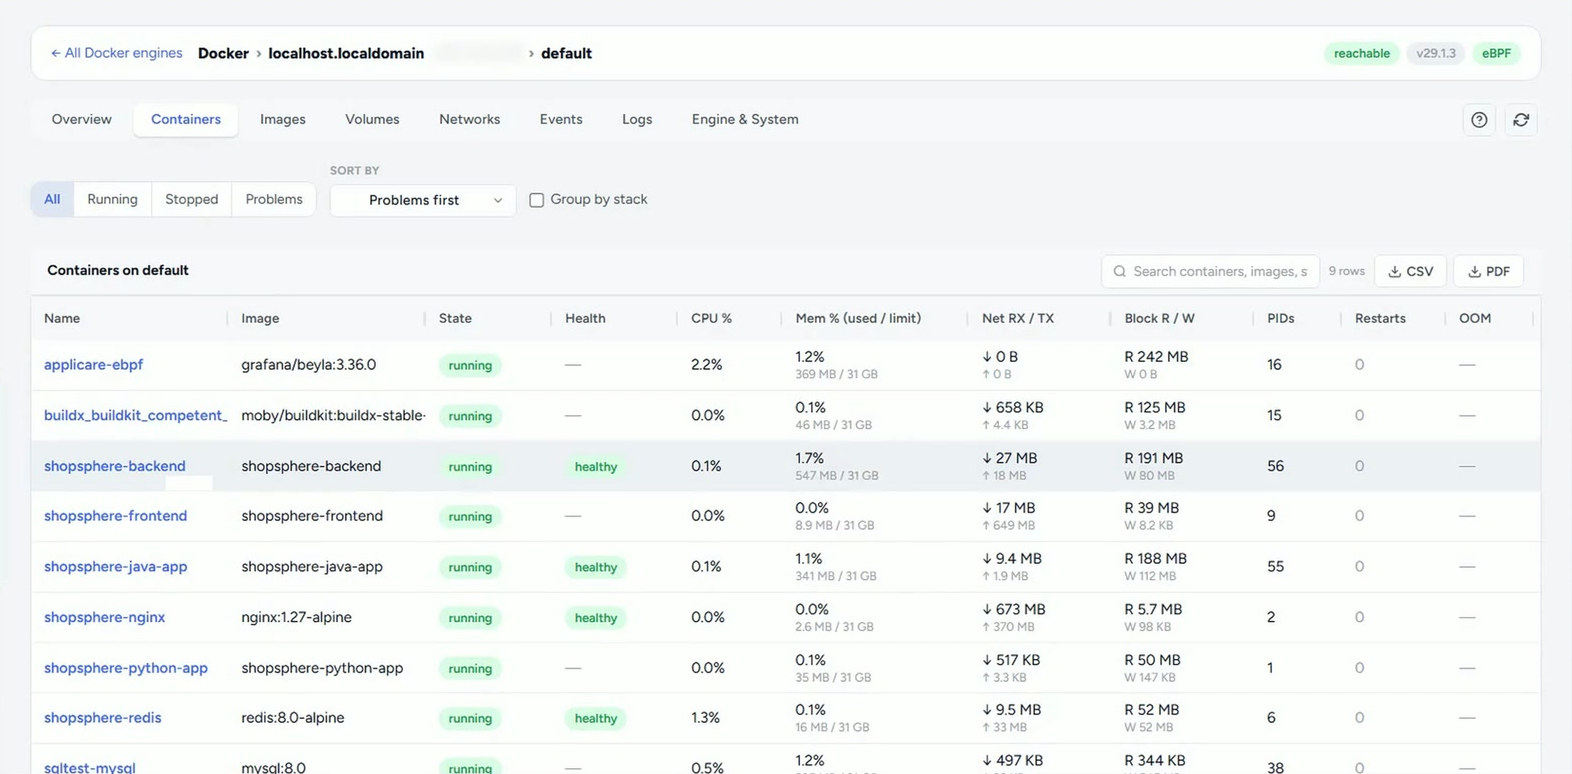
State, health, CPU, memory against its limit, network and block I/O, process count, restarts and out-of-memory kills for each container. Sort problems first, filter by state, group by stack, and export to CSV or PDF.

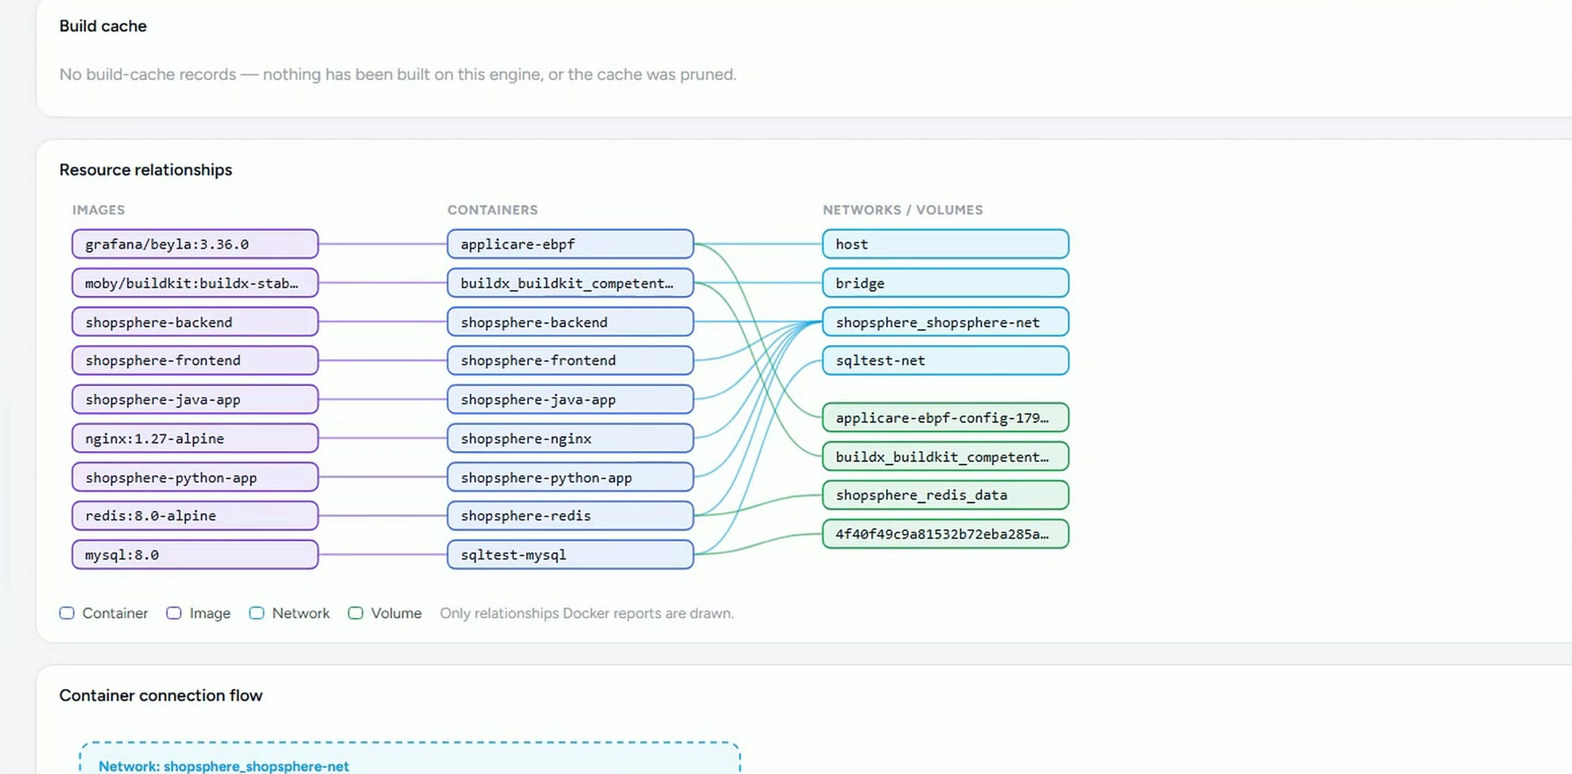
Images, containers, networks and volumes drawn together, so you can see what a container is built from and which networks and volumes it uses. Only relationships Docker reports are drawn.

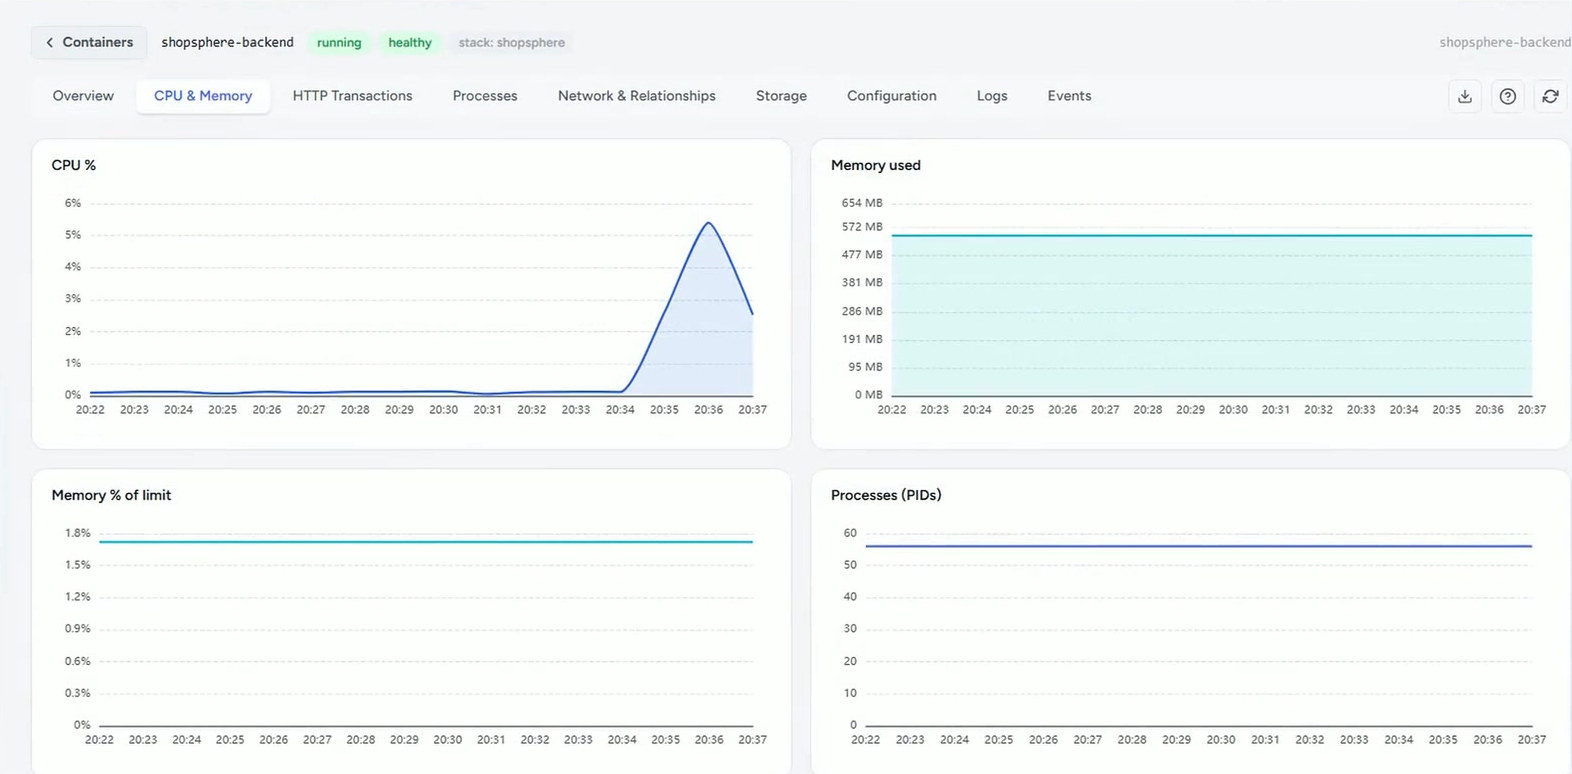
CPU and memory over time for a single container, with tabs for HTTP transactions, processes, network and relationships, storage, configuration, logs and events.

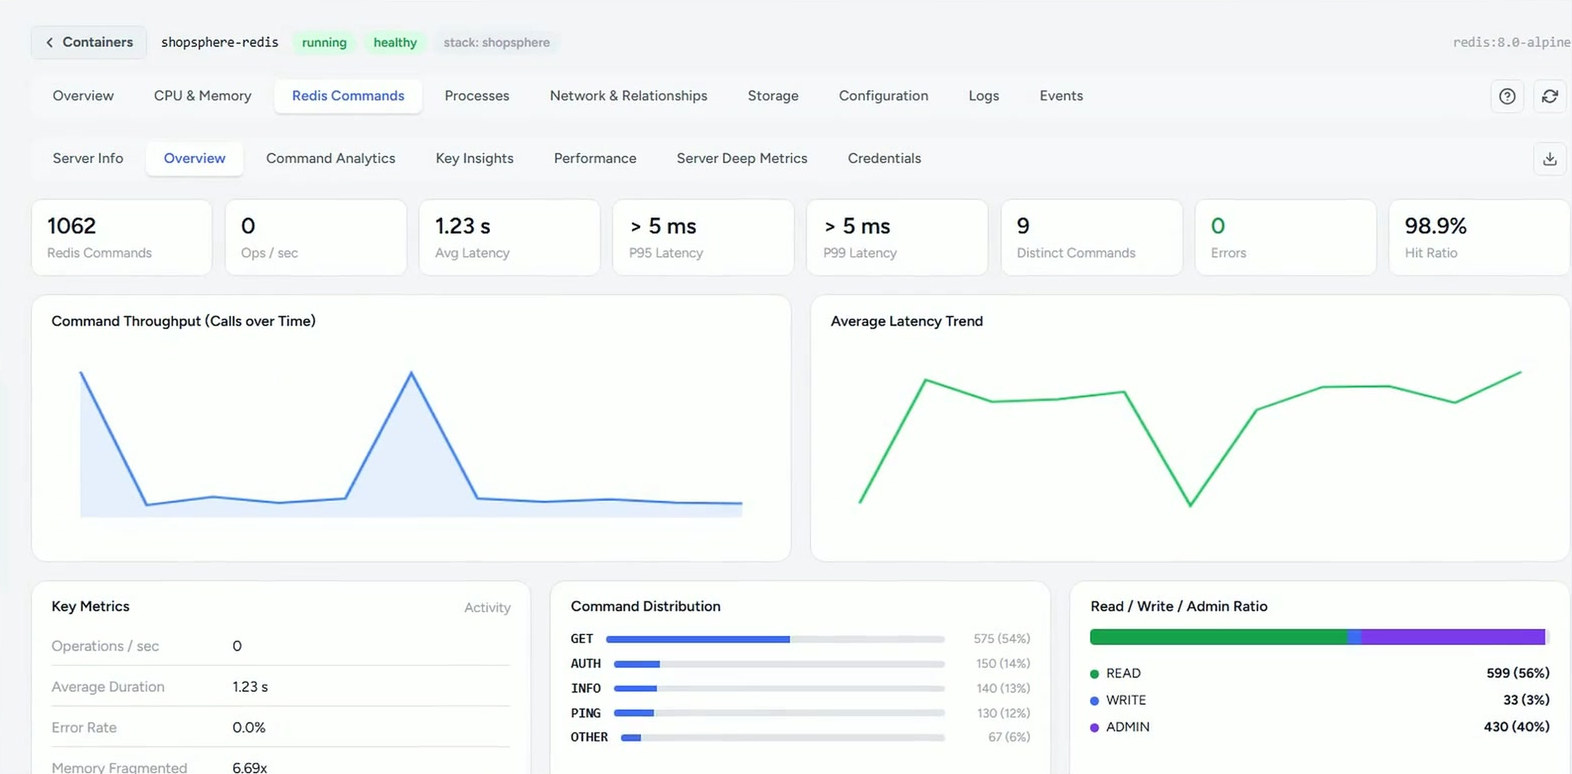
For a Redis container: command throughput over time, average latency trend, key metrics, command distribution and the read, write and admin ratio, with further tabs for command analytics, key insights, performance and server metrics.
Swipe to explore · tap Enlarge to zoom
Demo environment. Private addresses and credentials are blurred.
A 2:30 walkthrough: engine health, every container, image, volume and network, how they connect, container drill-down and Redis workload insight.
Everything below is shown in the Docker Monitoring walkthrough or in the Observed view above.
Register for a demo and we will walk through which of your containers talk to each other and where to look first.