The Platform

One causal entity graph. Four AI engines. Built for enterprise engineering teams who need answers, not dashboards.

⬡ Platform overview → ◯ Four engines → ▶ How it works → → Start free trial →

What we solve

Applicare enables teams to observe, automate, and resolve incidents faster across every stack.

★ Customer stories → → Try it free → ◯ Platform overview →
Learn
Blog
Engineering insights & deep dives
Webinars
Live sessions & on-demand recordings
Case Studies
Proven results across industries
White Papers
Research, architecture guides & reports
Customer Stories
Real teams, real outcomes
Product News
What’s new in Applicare
Adopt & Grow
Applicare University
Free courses for Applicare engineers
Learning Center
Every video lesson, searchable in one place
Documentation
Guides, APIs & integration docs
About Arcturus
Our mission, story & team
Partners
SI, MSP & technology partners
Community
Slack, GitHub & developer forum
Support
Helpdesk & customer portal
Downloads
Ops Vault
Datasheets, runbooks & toolkits
Troubleshooting
Diagnose & fix common issues
Release notes
What changed in each release
Featured Case Studies
AeroMexico
Digital ticketing · MTTR 4.5h → 11min
Leading Private Bank
MTTR 3.2h → 18min · first month
Mediclinic
Audit prep 11 weeks → 18 days
NTT DATA
80% on-call page reduction
Danube Group
94% SLO compliance
ONP
0 violations at last audit
Seygen
78% downtime reduction · GxP compliance
Insurance Tech Platform
67% P1 reduction · $2.4M saved
IIS & Server Availability
100% SLA report accuracy
Health Check Offering
4.2x ROI · 48hr delivery
Bank of Muscat
99.95% core banking uptime
Aster Hospitals
Deeper IIS application visibility
By Industry
Financial Services
Airlines & Transport
Healthcare
Government
Retail & E-Commerce
Pharmaceuticals
Insurance Technology
Managed Services
Enterprise IT
Professional Services
Home
ArcIn AI
Login Book a Demo
Docker Monitoring

Docker Monitoring with Applicare

See which containers talk to each other. Find where requests fail.

See which containers communicate, which networks and ports they use, and where errors or slow responses appear. Use observed traffic to decide which dependency to investigate first.

Observed trafficDocker networksPorts & protocolsError rate & p95
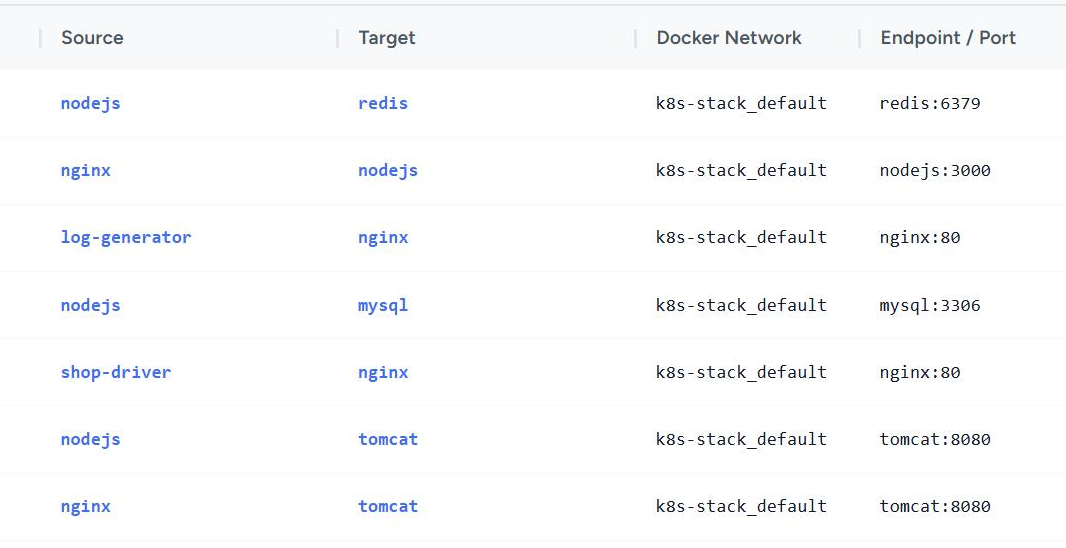
 applicare · Inter-Communication & Flows · Observed
Applicare Observed view: rows listing the source container, target container, Docker network and endpoint with port, for example nodejs calling redis on redis:6379 and nginx calling nodejs on nodejs:3000
Example data · last 1 hour. See the full table ↓
What teams can do

From a list of containers to a map of who calls whom.

Applicare lists the container-to-container calls it actually saw, so platform engineers, DevOps teams and SREs can answer four practical questions.

01
Map container dependencies
See which containers call which, built from traffic Applicare observed, not from a diagram someone drew.
02
Narrow the investigation
Use the error rate and p95 latency of the called container, where available, to choose which dependency to look at first.
03
Spot the busy paths
Call counts for the selected time range show which container-to-container paths carry the most traffic.
04
Know who calls it
Before you restart or move a container, see which services call it.
How it works in Applicare

Five clicks from the Docker menu to observed traffic.

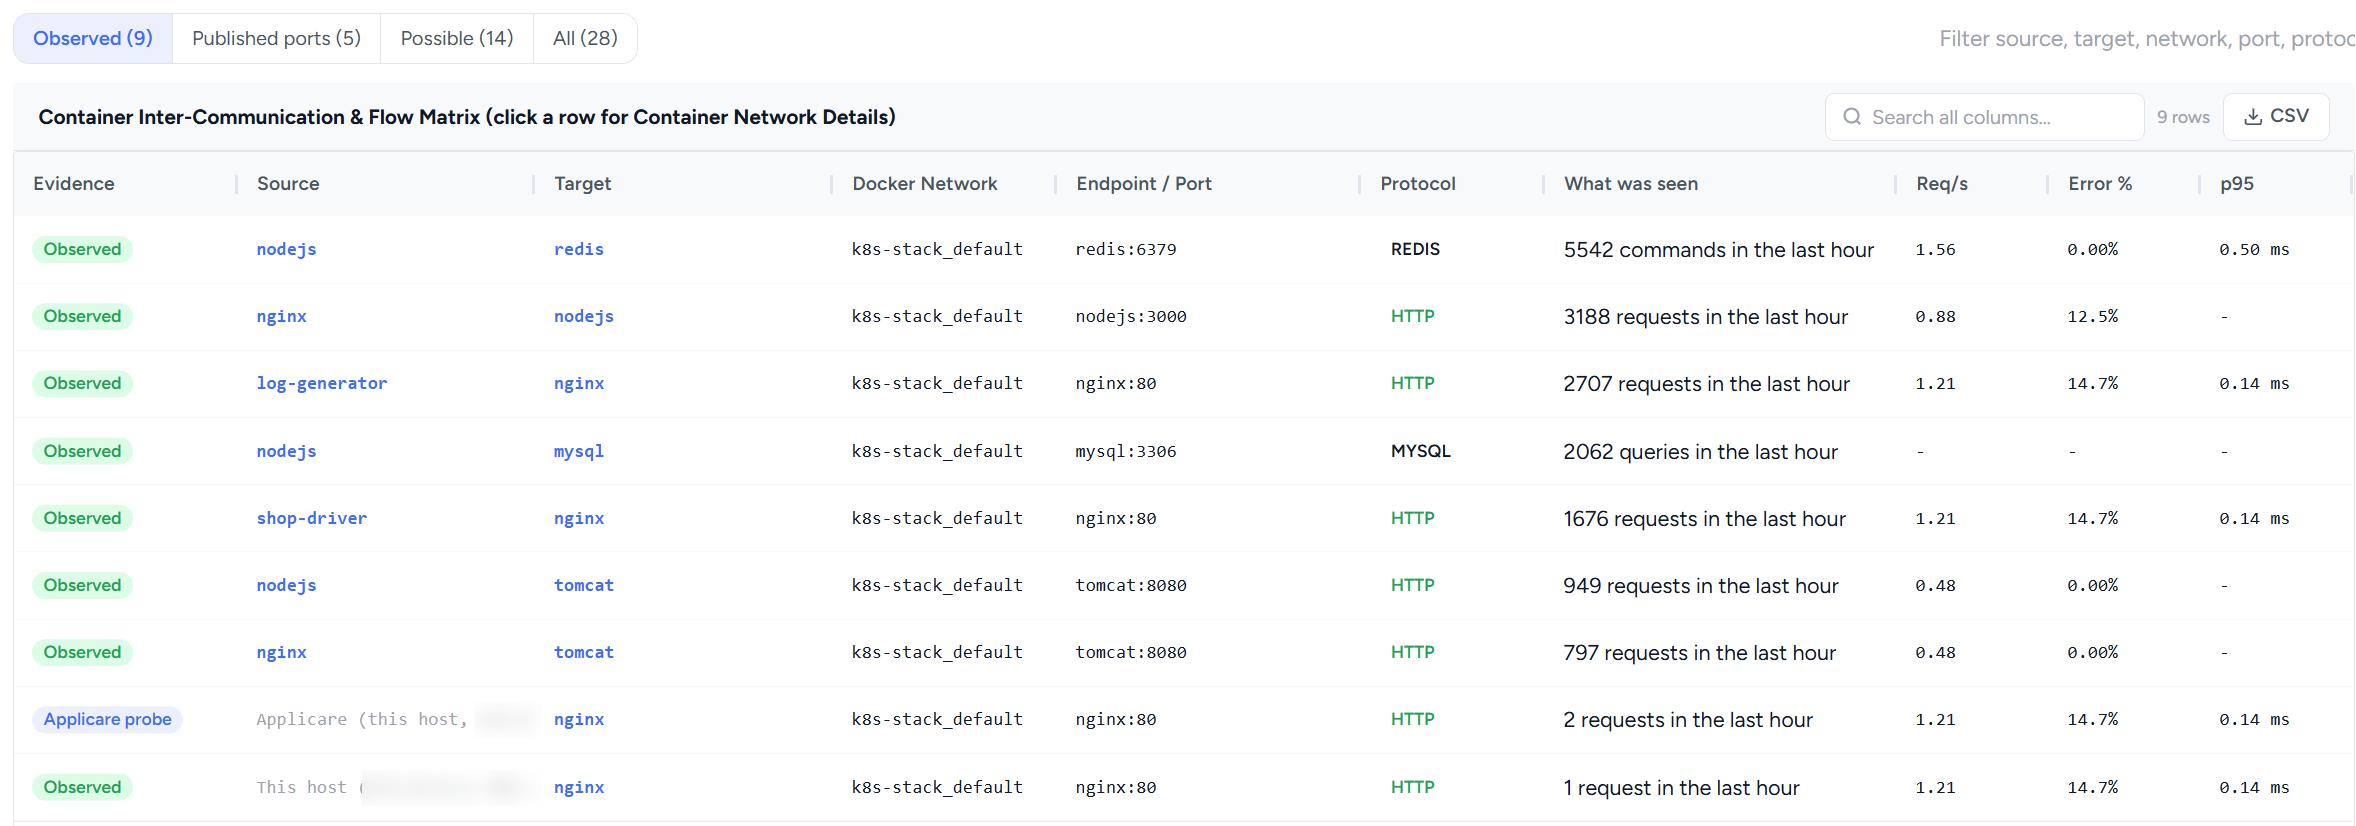
The Observed view lists every container-to-container call Applicare saw on the selected Docker engine: who called whom, on which port and protocol, how many times, and how the called container is doing.

  1. Step 1Docker
  2. Step 2Select an engine
  3. Step 3Networks
  4. Step 4Inter-Communication & Flows
  5. Step 5Observed

What each column shows

Source → Target
Who made the call and who answered. “This host” means a call from outside Docker.
Docker Network
The Docker network the call went over.
Endpoint / Port
The service and port that was called.
Protocol
The kind of call, such as HTTP, REDIS or MYSQL.
What was seen
How many calls Applicare saw in the selected time range.
Req/s · Error % · p95
Load, failure rate and response time of the called container. A dash means no data.

Observed or Applicare probe

ObservedApplicare probe

Every row is labelled. Observed is a real call between containers. Applicare probe is Applicare’s own health check, kept separate from the traffic your containers generate.

Drill down and export

  • Click a row to open that container’s network details.
  • Export the table to CSV.
  • Search across all columns to filter the rows.
Product screenshot and example

The Observed view, with example data.

This is the Container Inter-Communication & Flow Matrix for one Docker engine over the last hour. The two callouts below show how to read it.

 Docker › Networks › Inter-Communication & Flows › Observed · last 1 hour
Applicare Container Inter-Communication and Flow Matrix, Observed tab, nine rows. Columns: Evidence, Source, Target, Docker Network, Endpoint and Port, Protocol, What was seen, Req per second, Error percent and p95. Example rows include nodejs to redis with 5542 commands in the last hour, and nginx to nodejs with 3188 requests and a 12.5 percent error rate.

Swipe to explore · tap Enlarge to zoom

Example data from a Docker engine, last 1 hour, 9 rows. Private addresses are blurred.
Example data
nginx → nodejs
12.5% error rate

Calls from nginx to nodejs show a 12.5% error rate here, which makes that dependency a place to start investigating. Treat Error % as a signal for where to look, not as a diagnosis.

Example data
nodejs → redis
5,542 commands in the hour

In the selected hour, this is the busiest path in the table, so it is the first place to check when you want to know what carries the most traffic.

More of the Docker view

From engine health to the workload inside a container.

Screenshots from the Docker Monitoring walkthrough, taken from a demo. Choose a screen, then use Enlarge to see it full size.

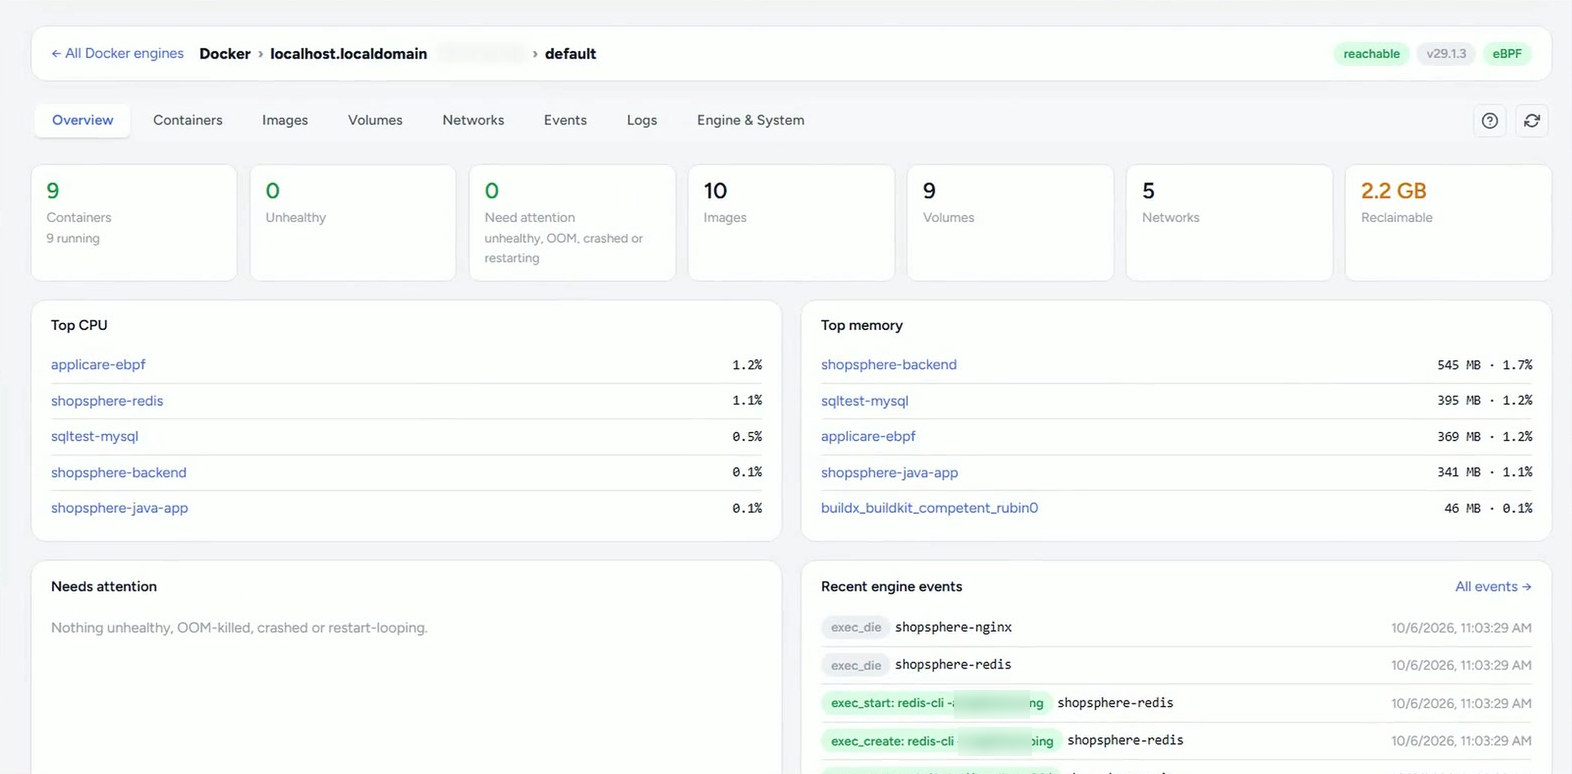
 Docker › Overview
Applicare Docker overview: 9 containers running, 0 unhealthy, 0 needing attention, 10 images, 9 volumes, 5 networks and 2.2 GB reclaimable, with top CPU and top memory consumers and recent engine events

Engine health at a glance

Containers running and unhealthy, anything that needs attention, and the number of images, volumes and networks, with reclaimable disk space. Top CPU and top memory consumers and the latest engine events sit below.

Swipe to explore · tap Enlarge to zoom

Demo environment. Private addresses and credentials are blurred.

See Docker Monitoring in action

Watch Applicare monitor a Docker environment.

A 2:30 walkthrough: engine health, every container, image, volume and network, how they connect, container drill-down and Redis workload insight.

Docker Monitoring with Applicare · 2:30 · narrated
Docker capabilities

What Applicare shows for Docker.

Everything below is shown in the Docker Monitoring walkthrough or in the Observed view above.

Engine
Engine health at a glance
Running and unhealthy containers, top CPU and memory consumers, recent engine events and disk usage.
Inventory
Every resource in one place
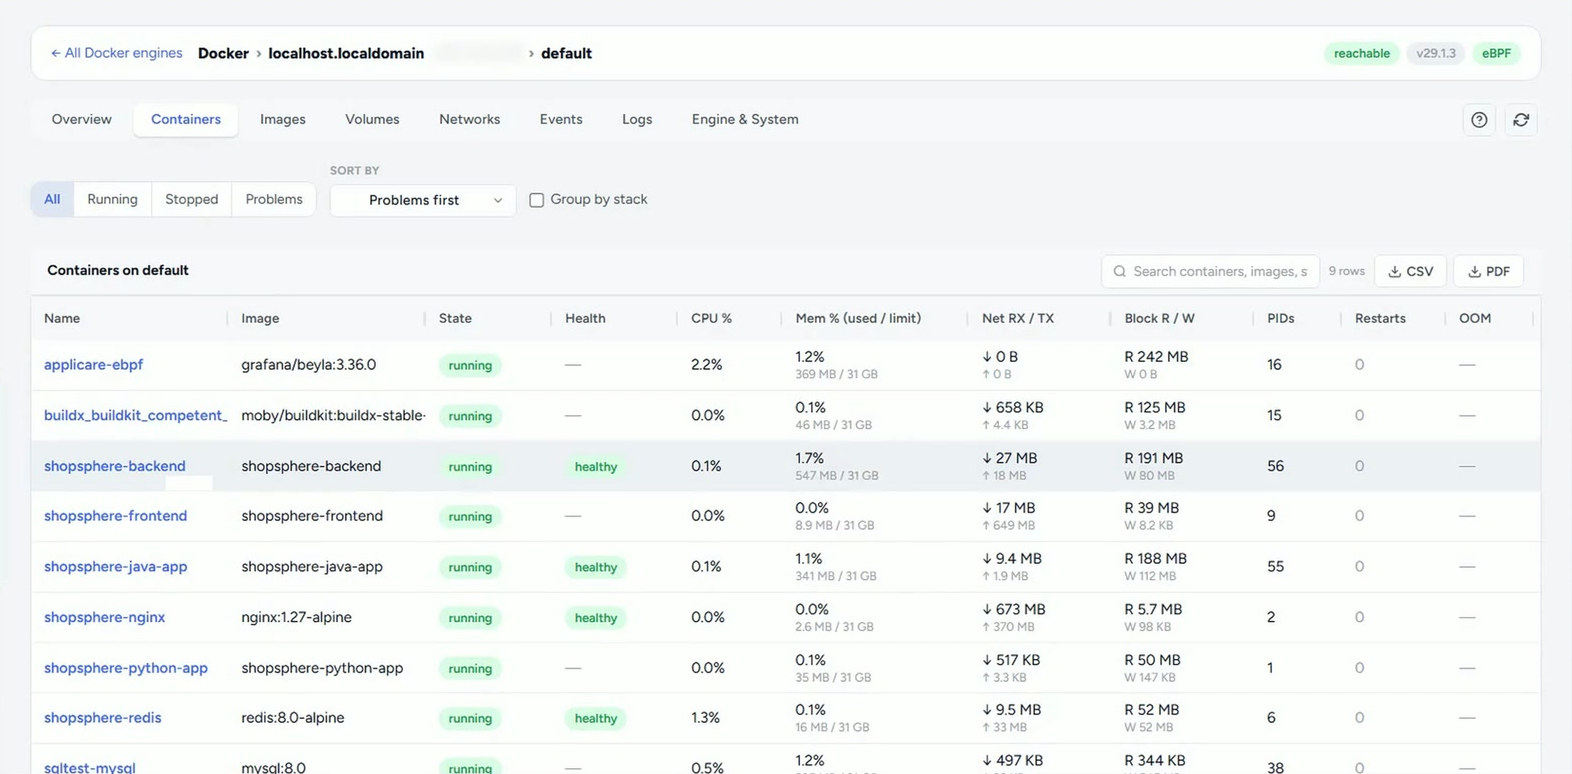
Containers, images, volumes and networks, with events and logs alongside.
Topology
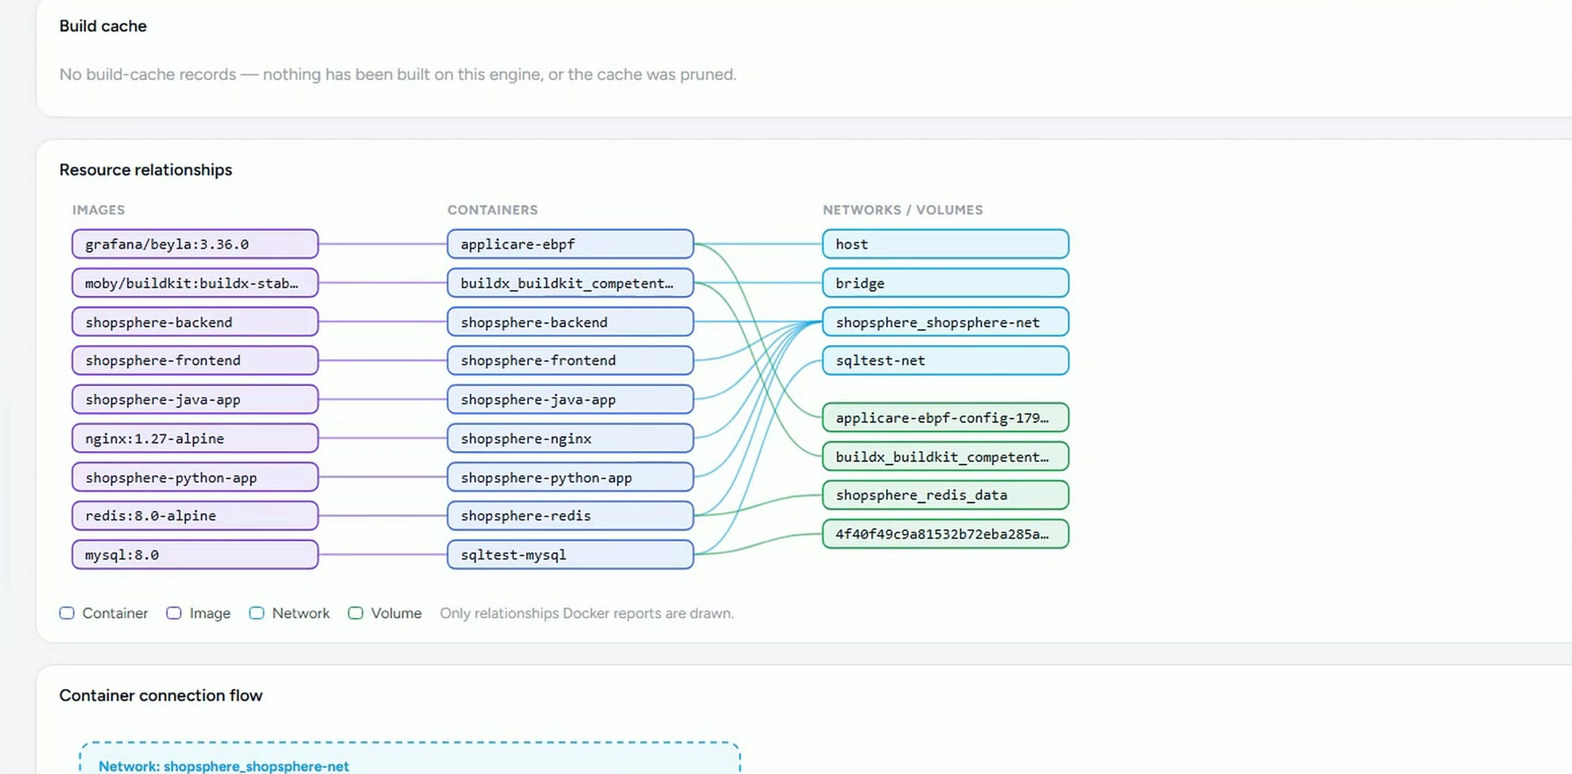
Resource map
See how images, containers, networks and volumes connect.
Container
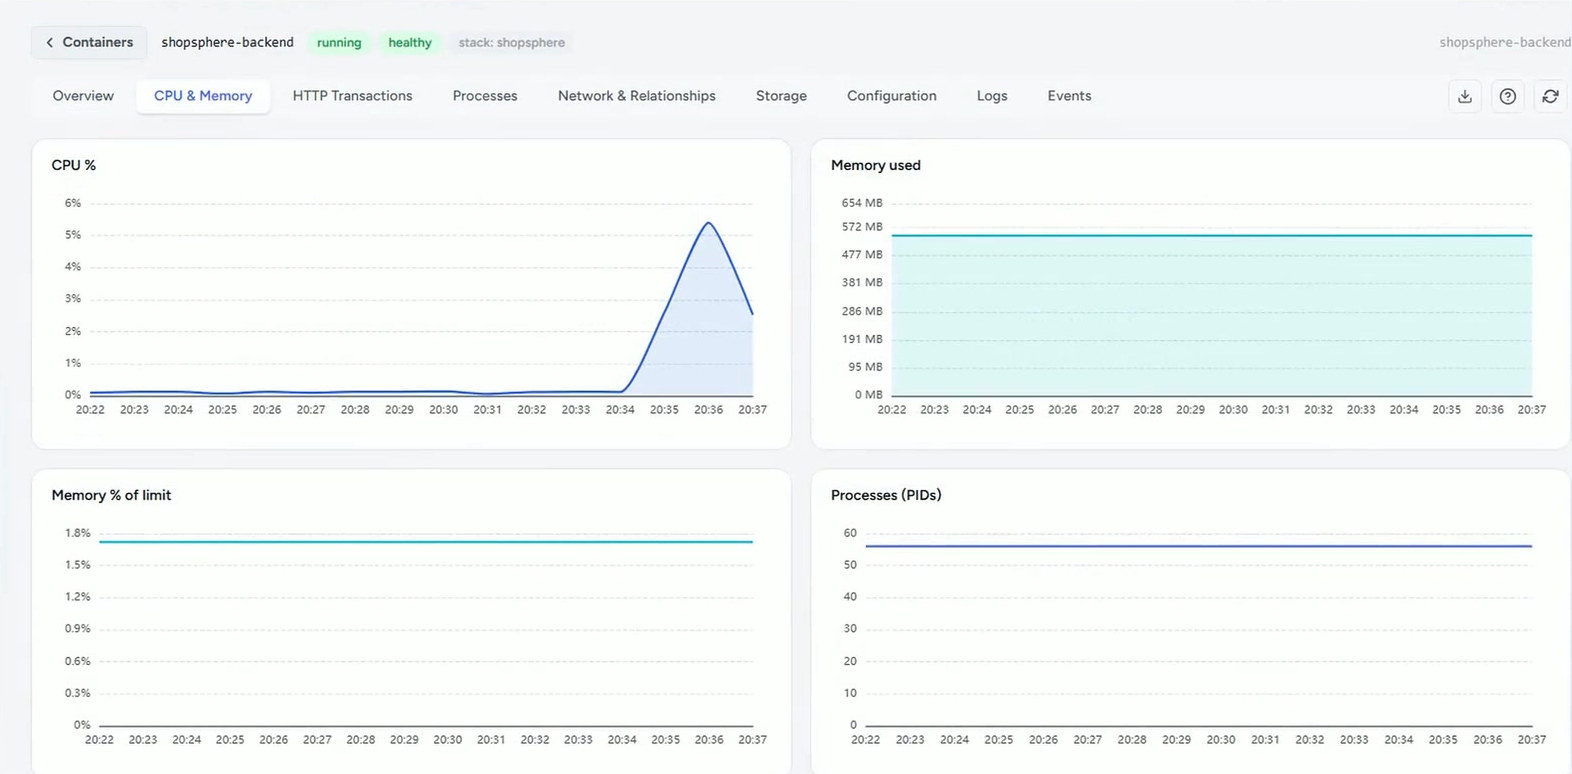
Container drill-down
CPU and memory over time, processes, network relationships, storage and configuration.
Network
Container communication
Which containers call which, on which network, port and protocol, with call counts and the called container’s error rate and p95.
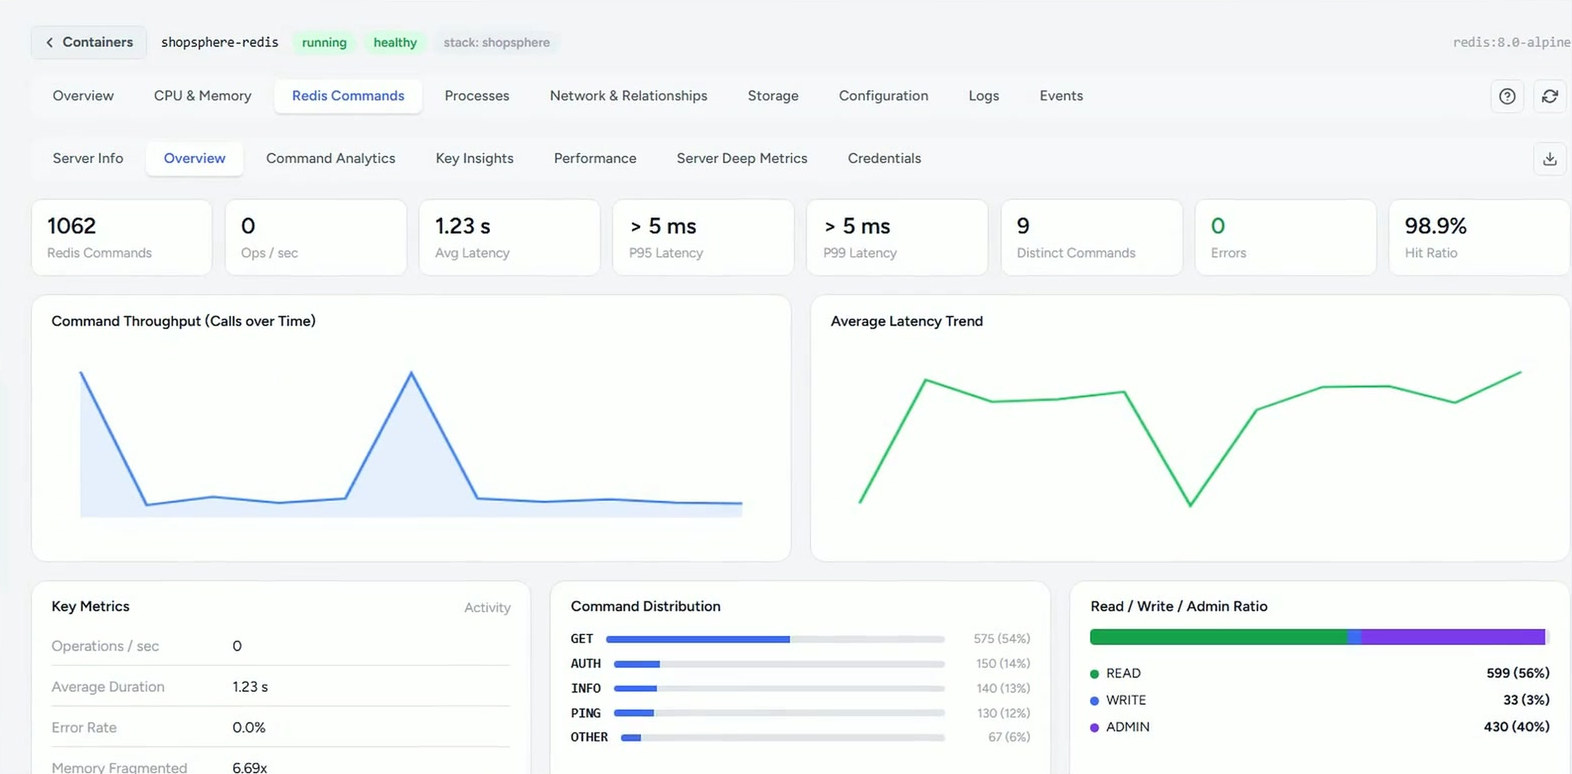
Redis
Redis workload insight
Command throughput and distribution, latency and errors.

See Docker Monitoring in your environment.

Register for a demo and we will walk through which of your containers talk to each other and where to look first.